Application Dashboard
The Application Dashboard presents a snapshot of the Applications transiting the network, it lists the Application groups Bit Rate, and a set of widgets that display the status of Top Application by, Bytes/Flows, Performance, Voice/Video Performance, and HTTP Host. Within each Widget, the order can be displayed from Highest to Lowest, or vice-a-versa by clicking on the title bar within each widget.
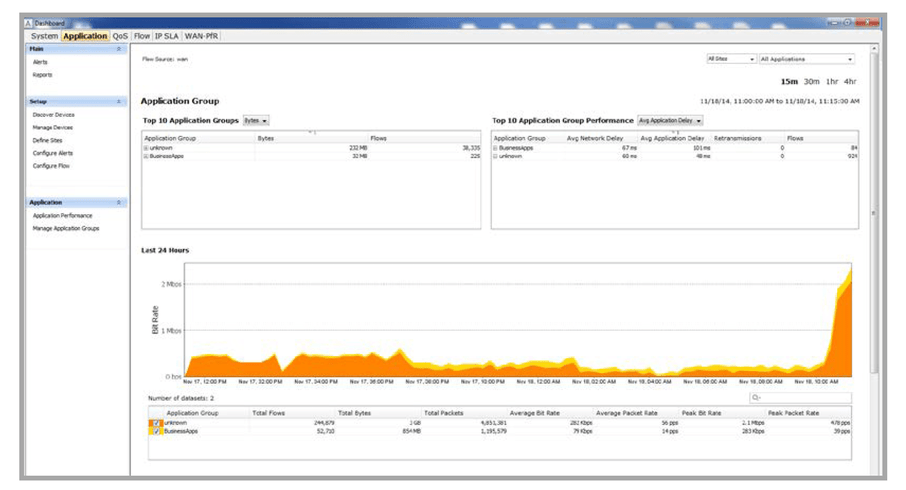
In the top right, there is two drop-down selections that provide more granularity for the dashboard. The first is used to display the results per site or all sites. The Second is used to display the results per application, or all applications.
The Application Performance in the Action menu will open the Flow reports section which is covered later in this chapter.
The Manage Application Groups will open the Manage Application Dialog which allows the user to manage the Application groups by adding, deleting or editing the groups already defined.